The Point of PowerPoint in SophLit
2. Demographics
The population for our studies was mostly traditional students, representative of the university at large. Abilene Christian University is a private, residential university in Abilene, Texas, founded in 1906. Its 4,600 students are heavily Texan but do represent all 50 states and 60 foreign countries. The university's stated mission is to educate students for Christian service and leadership throughout the world. Like the Churches of Christ, from which it draws 71 percent of its students, the university is heavily Anglo. Traditionally a liberal arts university, it has become increasingly vocational and preprofessional since the 1960s.
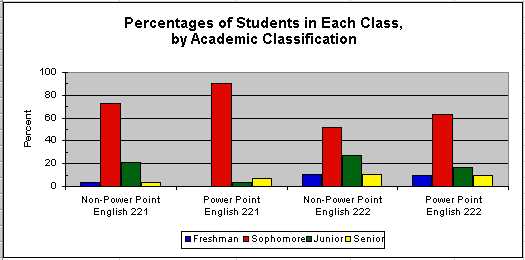
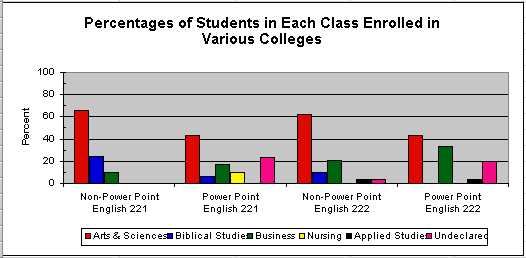
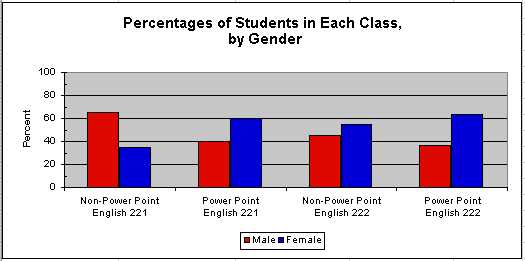
Below is a table on age distribution and average GPA, followed by a table on academic classification, undergraduate college, gender, and ethnicity. Finally, three graphs visualize classification, college, and gender. No graph is provided for ethnicity since it is overwhelmingly white (approximately 86 and 93 percent for the two sets of classes).
|
|
||||
|
|
|
|
||
|
|
|
|
|
|
| Age: | ||||
| Average | 20.1 | 20.4 | 21.4 | 20.5 |
| Standard Deviation | 1.9 | 5.1 | 4.5 | 2.1 |
| College GPA: | ||||
| Average | 3.3 | 3.4 | 3.1 | 3 |
| Standard Deviation | 0.7 | 0.5 | 0.6 | 0.5 |
| High School GPA: | ||||
| Average | 3 | 3.3 | 3.5 | 3.4 |
| Standard Deviation | 0.5 | 0.4 | 0.6 | 0.7 |
|
|
||||
| Number of Students in Class* |
|
|
|
|
| *Information not available for all these attributes on all students | ||||
|
|
||||
|
|
|
|
||
|
|
|
|
|
|
| Academic Classification: | ||||
| Freshman | 3.4 | 0.0 | 10.3 | 10 |
| Sophomore | 72.4 | 90 | 51.7 | 63.3 |
| Junior | 20.7 | 3.3 | 27.6 | 16.7 |
| Senior | 3.4 | 6.7 | 10.3 | 10 |
| College in Which Enrolled: | ||||
| Arts & Sciences | 65.5 | 43.3 | 62.1 | 43.3 |
| Biblical Studies | 24.1 | 6.7 | 10.3 | 0 |
| Business | 10.3 | 16.7 | 20.7 | 33.3 |
| Nursing | 0 | 10 | 0 | 0 |
| Applied Studies | 0 | 0 | 3.4 | 3.3 |
| Undeclared | 0 | 23.3 | 3.4 | 20 |
| Gender: | ||||
| Male | 65.5 | 40 | 44.8 | 36.7 |
| Female | 34.5 | 60 | 55.2 | 63.3 |
| Ethnicity: | ||||
| White | 93.1 | 93.3 | 86.2 | 86.7 | Black | 3.4 | 0 | 6.9 | 0 |
| Hispanic | 3.4 | 0 | 6.9 | 6.7 |
| American Indian | 0 | 3.3 | 0 | 0 |
| Other | 0 | 3.3 | 0 | 6.7 |
|
|
||||
| Number of Students in Class |
|
|
|
|
|
|
|
|
|